
debugging for dummies


I’m going to quickly talk about debugging. Debugging properly is like LaTex; it feels slow and really annoying at first, but once you get used to it it’s actually much faster and makes people take you more seriously.
I’m going to include screenshots from Visual Studio Code because it’s become the canonical model for IDEs — it has design gravity, meaning that getting used to debugging here gives you fluency in most coding environments.
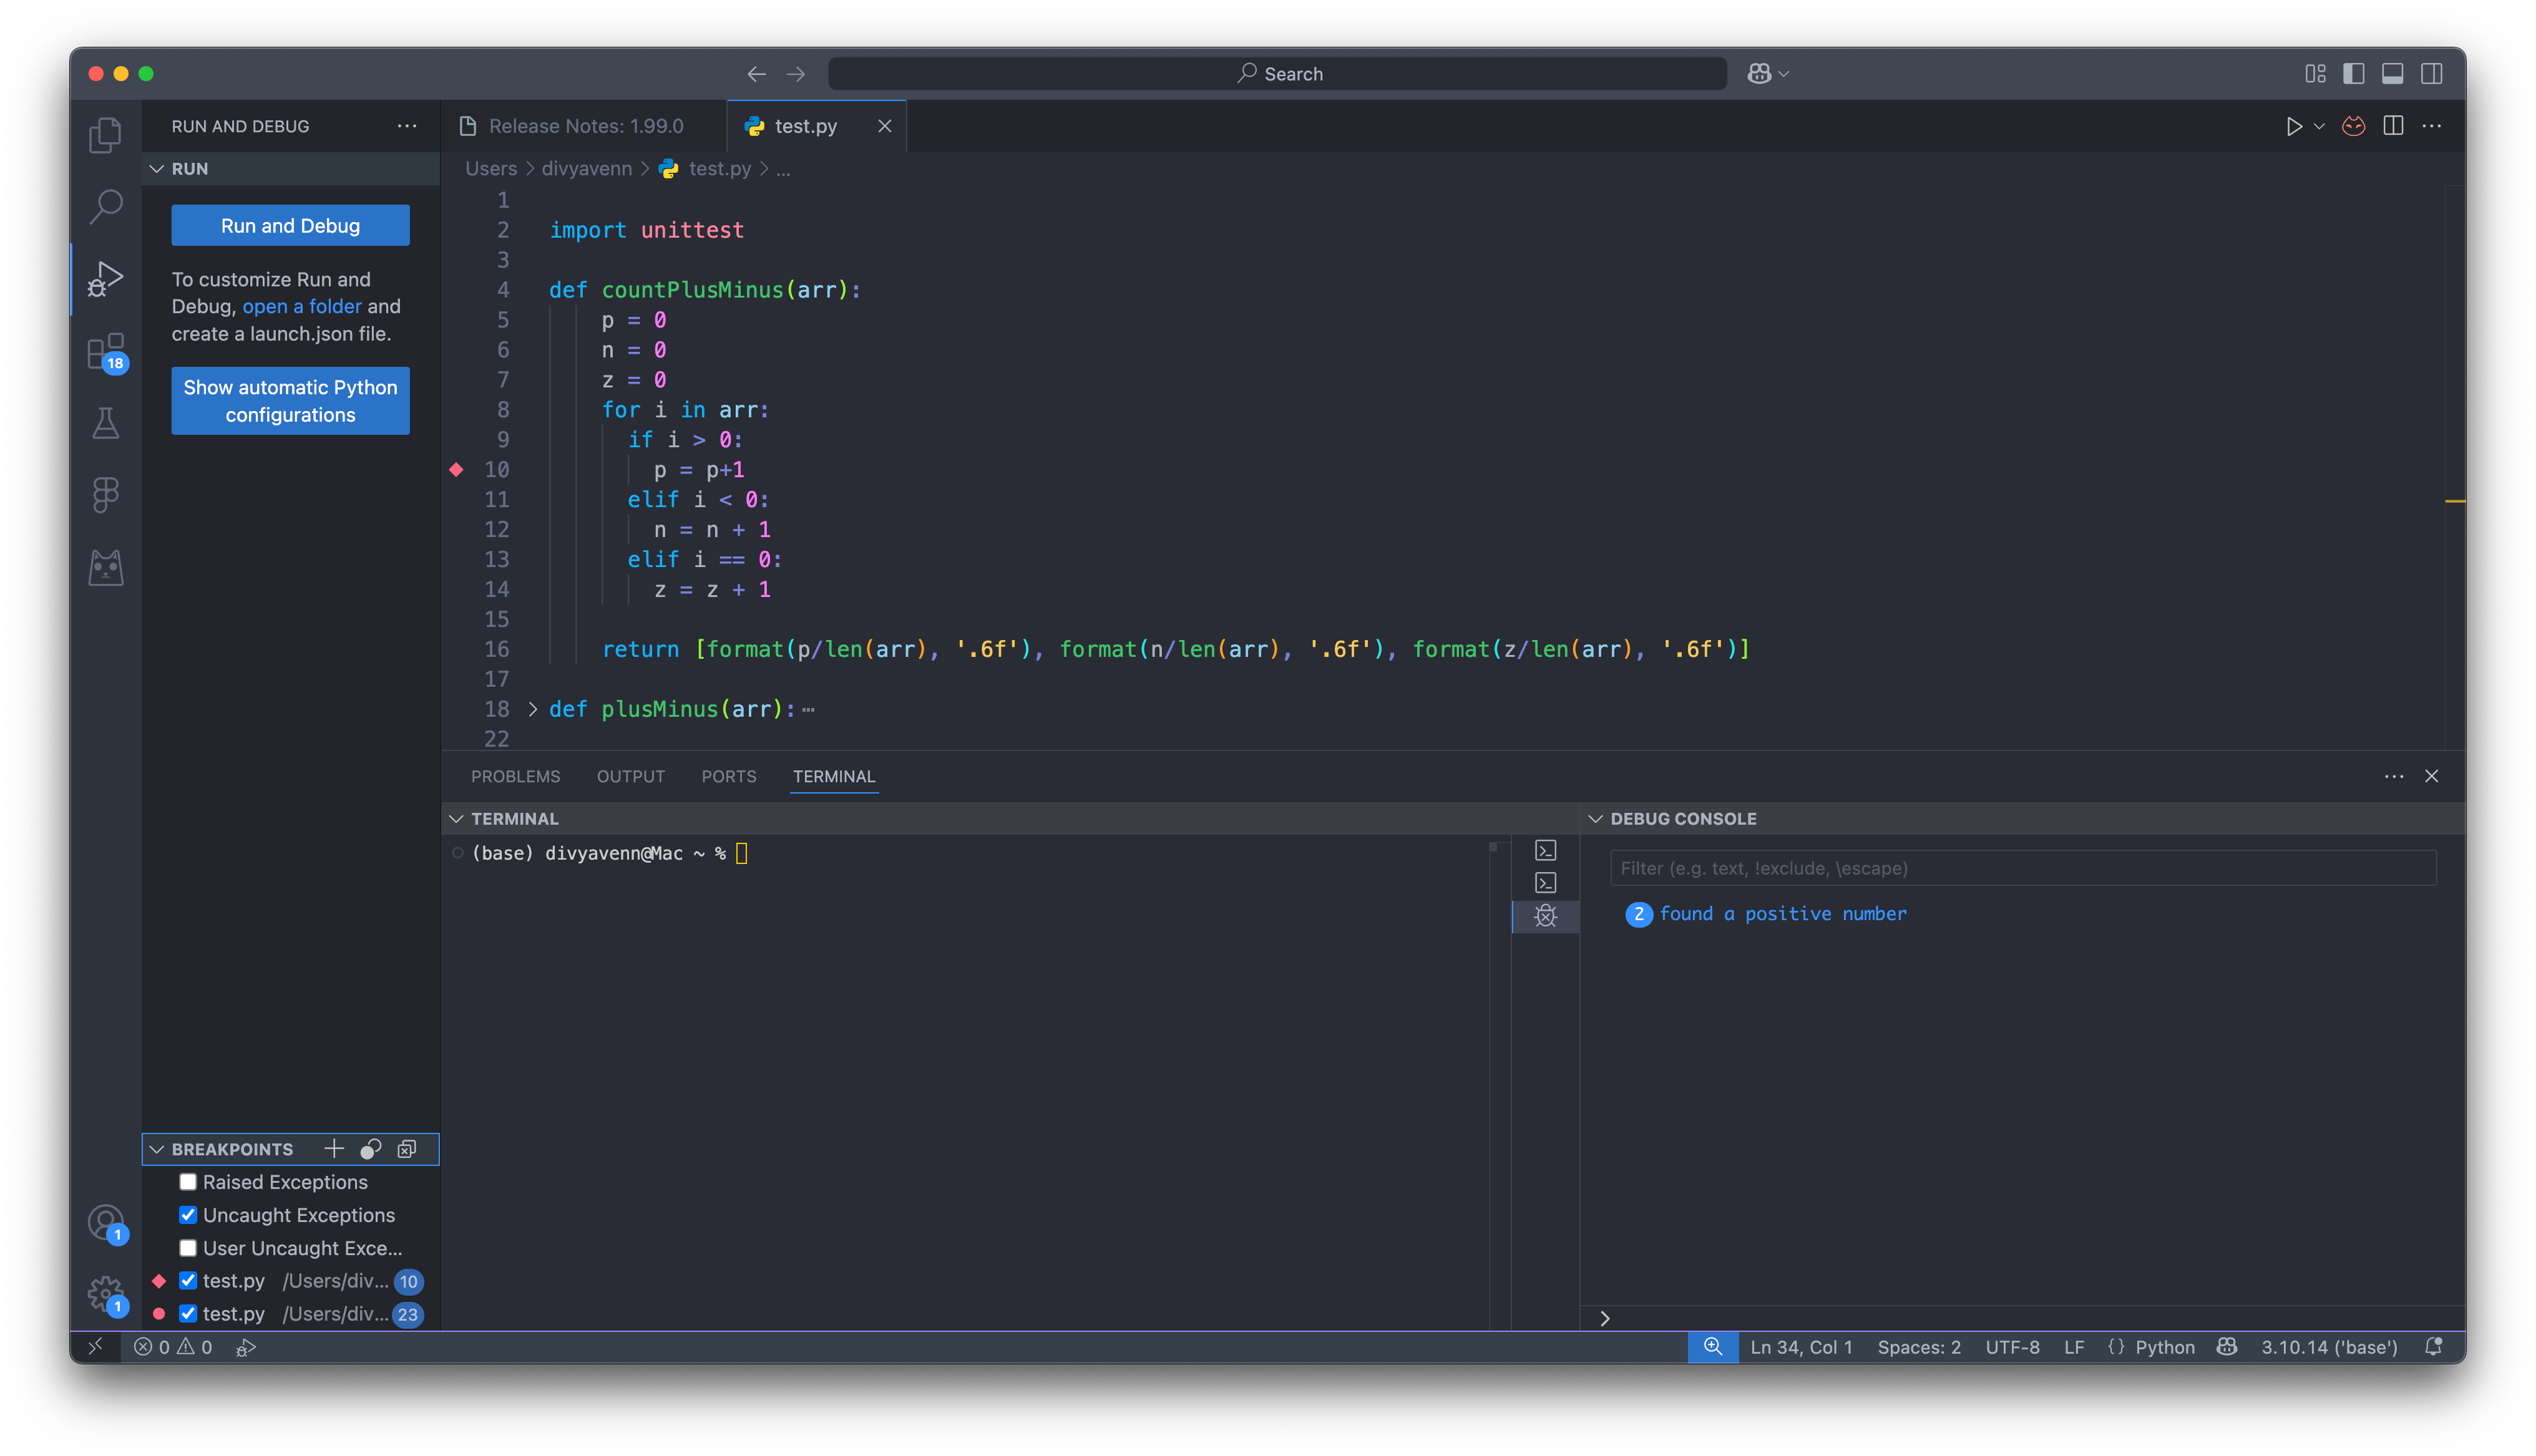
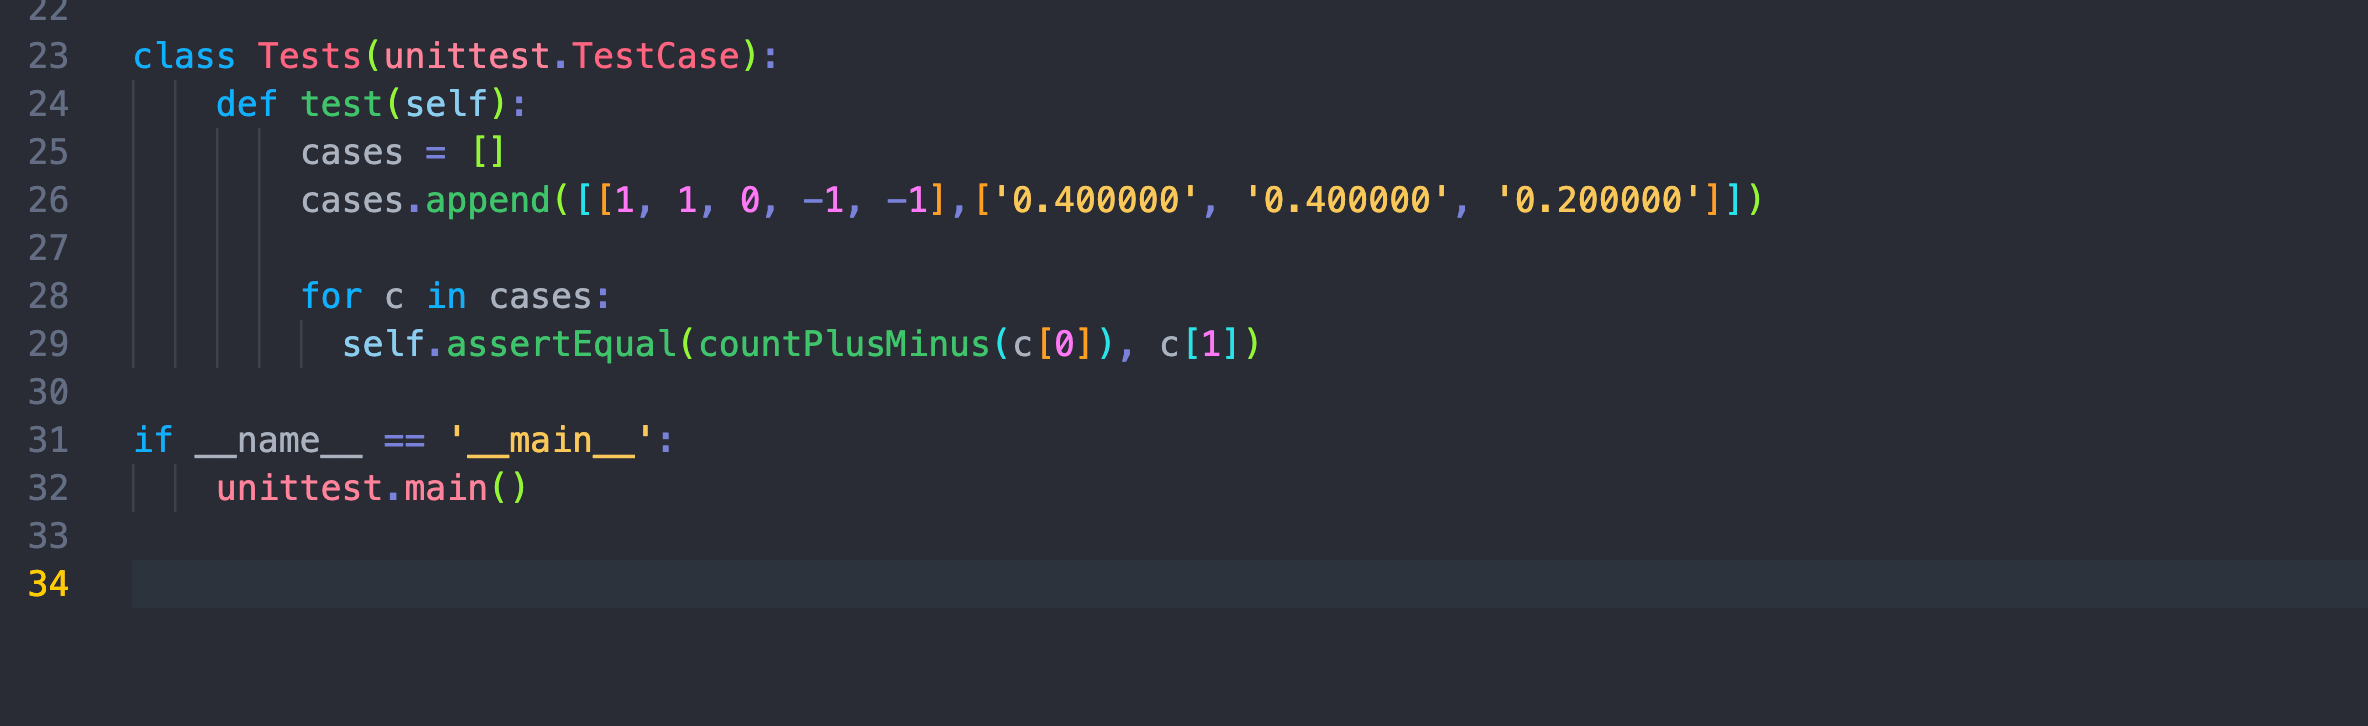
You need to have the Debug Console and the Run and Debug tab open. It’s also good practice to have testing set up. Here I’m using unittest, Python’s native testing module.
I’ve made it easy for myself to add test cases by creating a list of cases and running them all in a for loop.
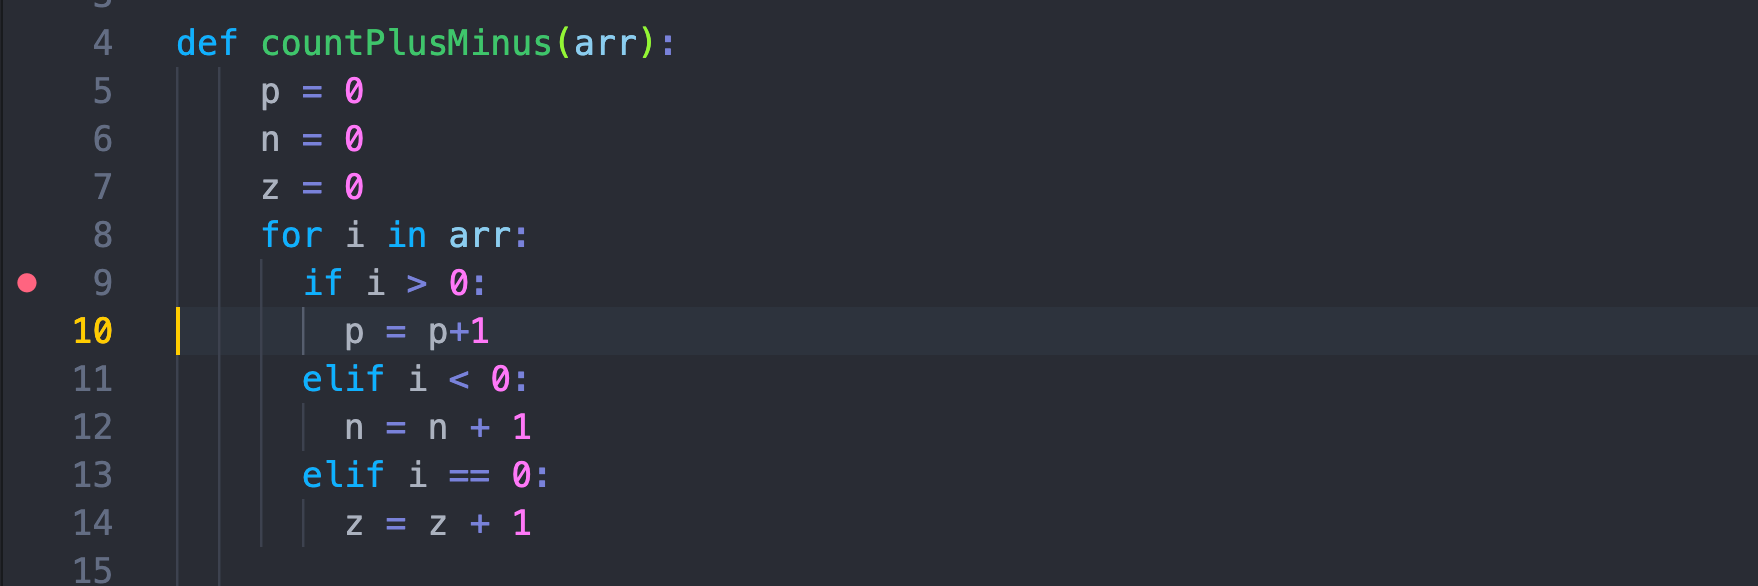
Right clicking on a line lets you add a breakpoint.
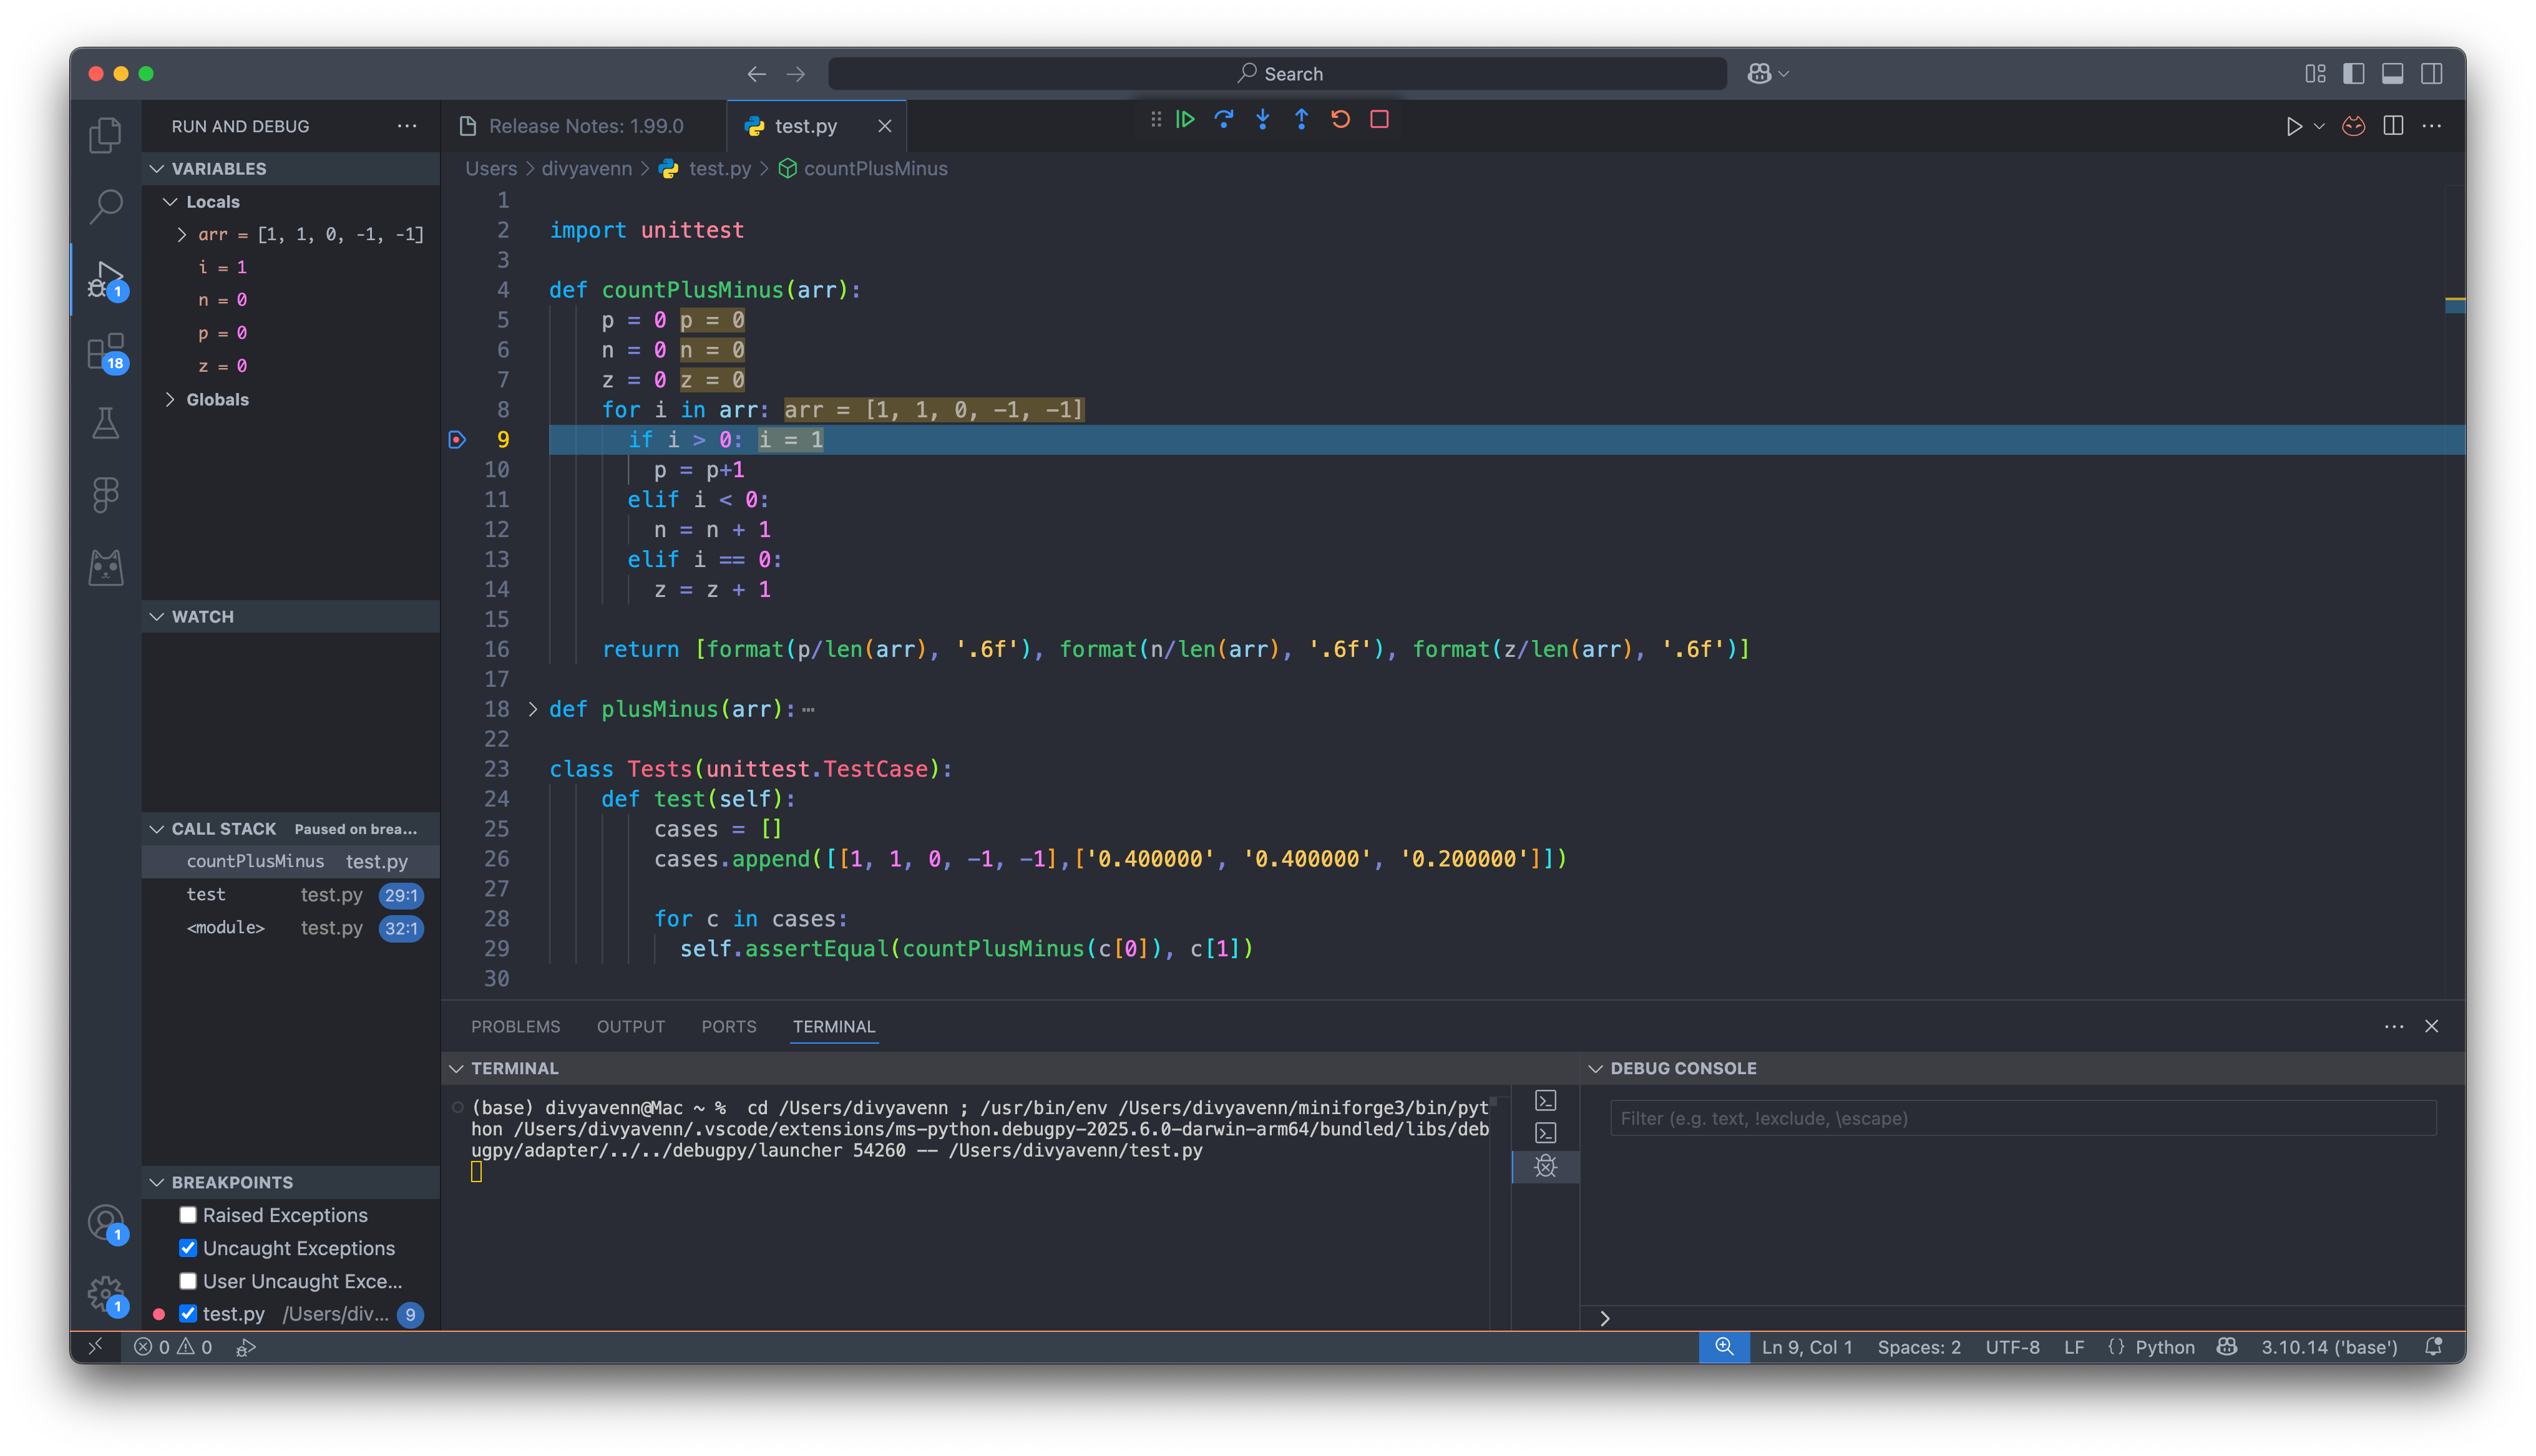
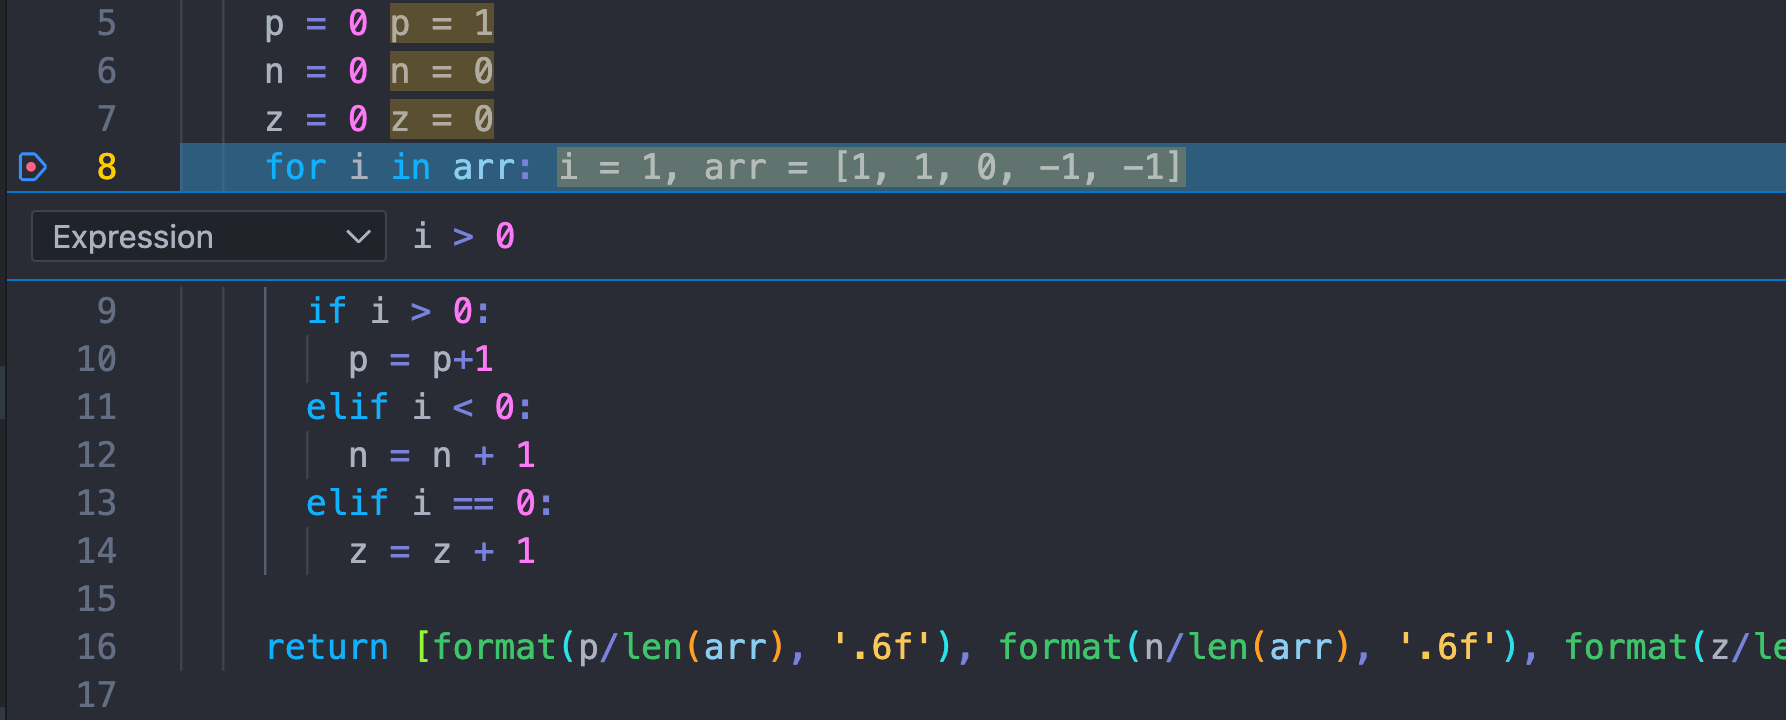
Now, when the program is run, you get some new information. In the debug console, you can track the values of local and global variables in the Variables Panel. VS Code also conveniently displays it inline in the file (this is a setting you can toggle). You can also hover over any variable to see its current value.
You can also temporarily change the values of variables in the Debug Console to experiment without creating a new test case.
On top, five standard buttons let you control the flow of the program from here.
Continue runs the program till the next breakpoint is hit.
Step Over lets you go line by line. If a function is called, it steps over it.
Step In moves into the body of the function that’s about to be called.
Step Out runs the rest of function you’re in and returns to the calling function.
Restart and Stop are self explanatory.
You can also edit the breakpoint make it conditional.
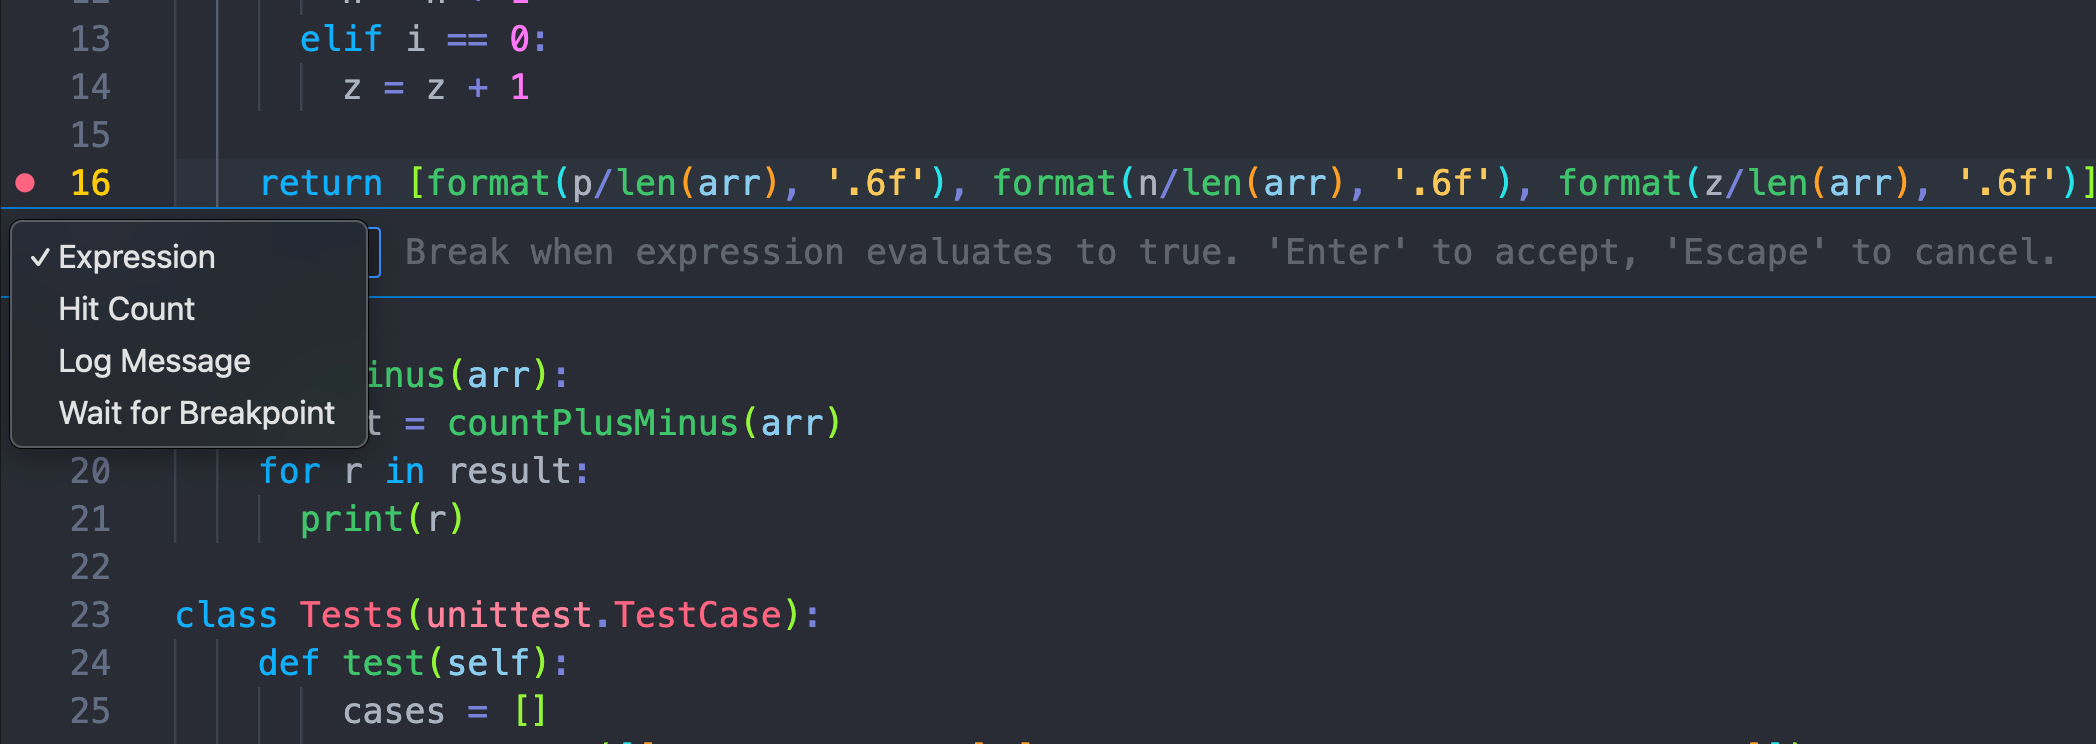
An expression lets you pause the debugger only when a certain condition is met. You use the same syntax you’d use inside a normal if statement. For example:
i > 0z >= 0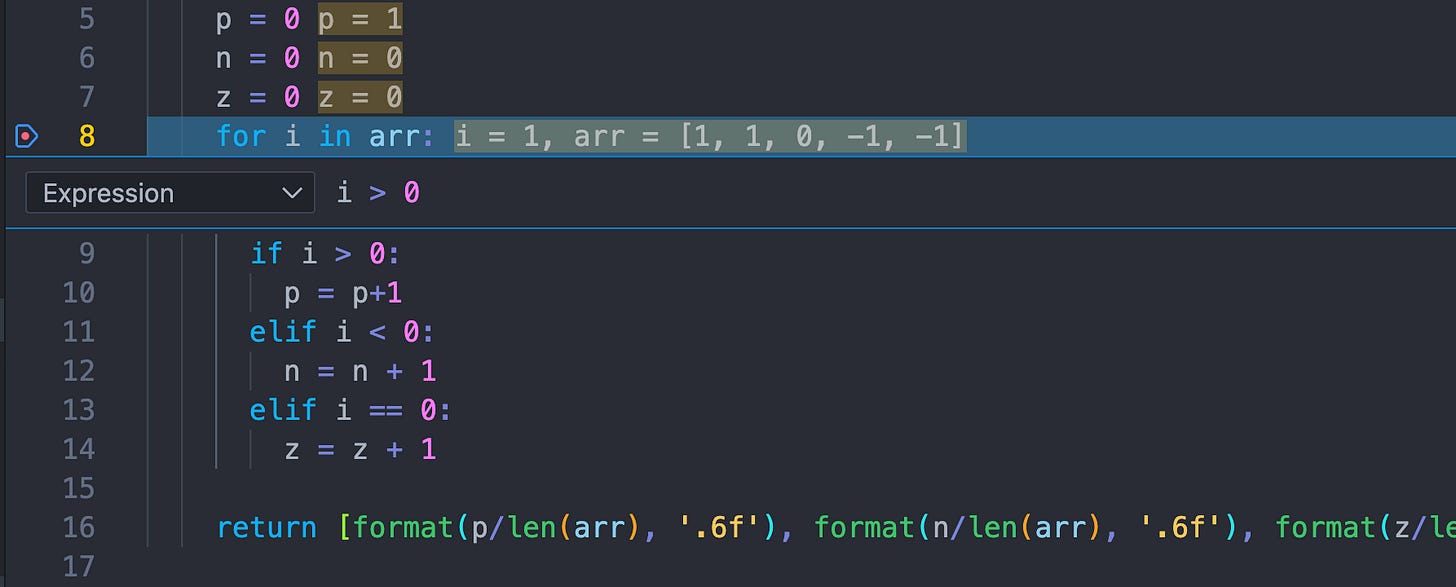
The hit count lets you pause the Nth time the statement is reached:
-5→ Pause on the 5th time breakpoint is hit>= 10→ Pause when hit count is 10 or more%2 == 0→ Pause every even hit (modulo logic)
The log message lets you print a message to the debug console instead of pausing. These can disabled and enabled very easily and are much more sophisticated than just typing print statements in your code. You can use curly braces to include runtime expressions. For example: x is {x}, i is {i}. Not that quotation marks are not needed; it’s already assumed whatever you type will evaluate to a string.
Finally, wait for breakpoint causes execution to wait until another thread hits the breakpoint — useful for race condition debugging or coordinating thread state.
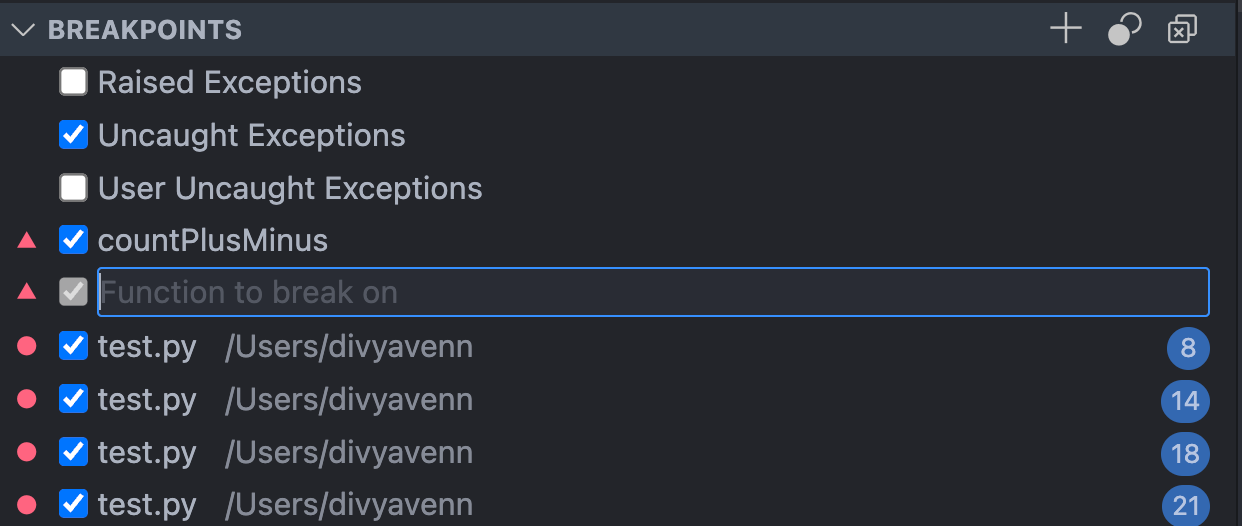
All your breakpoints are in one place, in your breakpoints tab. You can enable and disable breakpoints, as well as tell the program to pause at certain function calls.
You can also have the program automatically break when exceptions are raised, raised but not caught in any of the code, or raised but caught in a library rather than the user’s code.
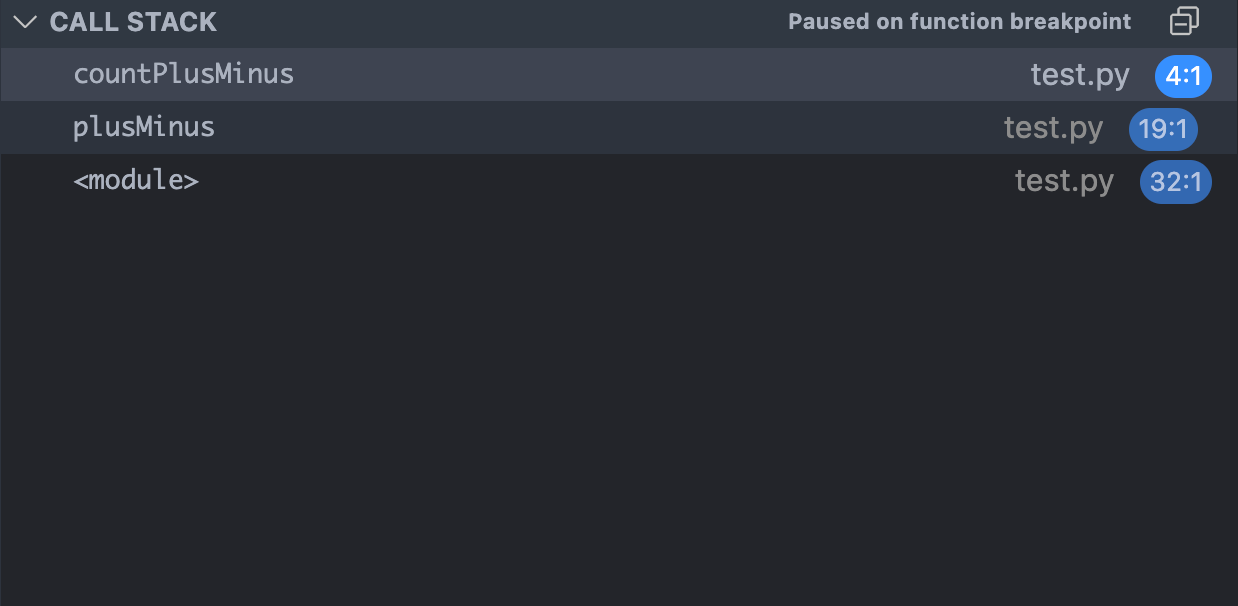
The call stack shows you how you got to where you are in the code. This is especially useful when one subroutine is called by many different functions and you’re trying to trace an error.
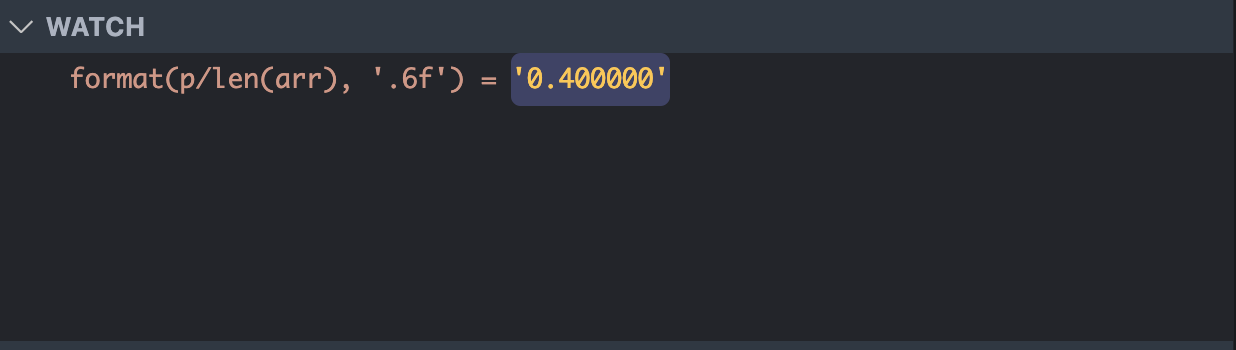
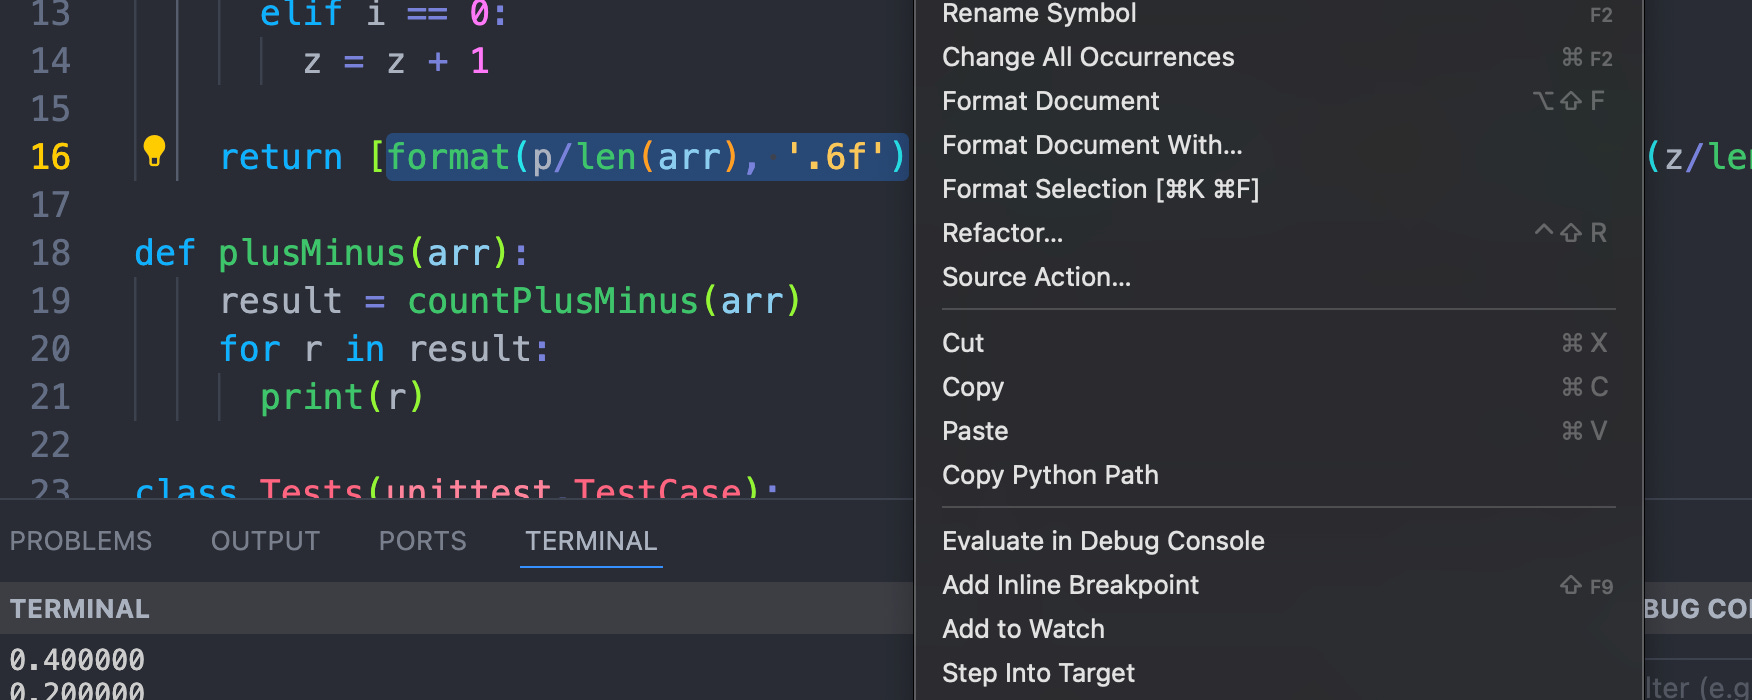
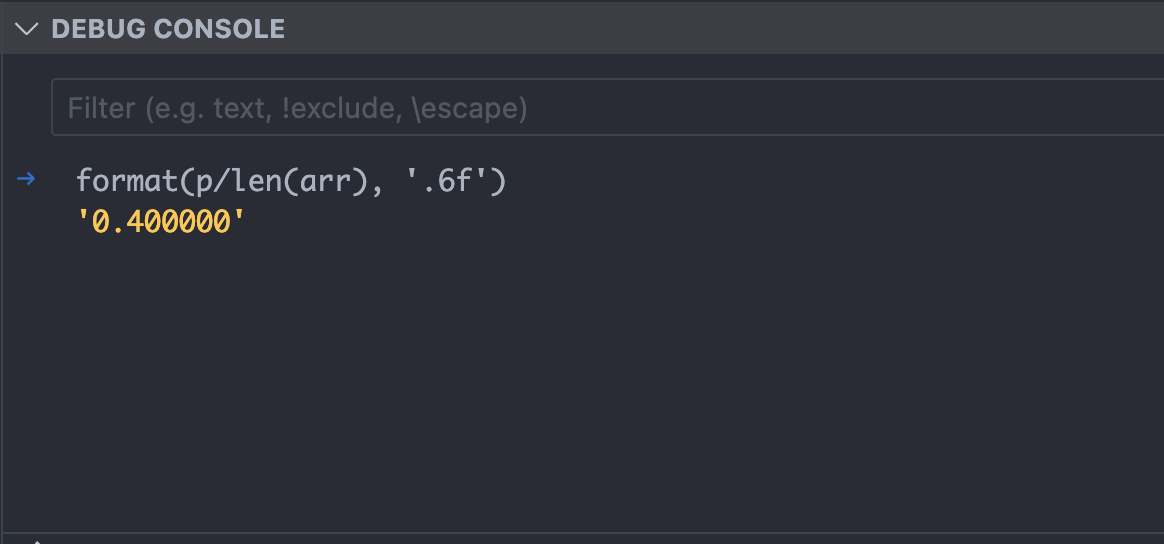
Finally, the watch list lets you track the results of entire expressions as variable values change. You can also highlight expressions in the code in the middle of debugging, right click, and press “Evaluate in Debug Console” to quickly check values without adding to the watch list.
Thanks for putting this together, glad no idea some of these debugger features!